A Nervous Market
May 6, 2010, was already tense before anything went wrong. Europe's sovereign debt crisis was accelerating: Greece teetered on the edge of default, violent protests had erupted in Athens over austerity demands, and overnight yields on Greek government bonds had spiked to levels unseen since the country joined the eurozone. Contagion fears were spreading to Portugal, Spain, and Italy, and traders questioned whether European institutions could contain the damage.
U.S. equity markets opened sharply lower that Thursday, reflecting anxiety from across the Atlantic. By early afternoon the S&P 500 had already dropped roughly 2.5 percent, and the CBOE Volatility Index — the VIX — had surged more than 20 percent. Trading volumes were elevated but not unusual. It was the kind of broad, fear-driven selloff markets experience several times a year: a bad day, not yet a strange one.
What transformed an ordinary down day into the most dramatic intraday collapse in modern market history was a single sell order — executed by an algorithm that had no regard for the fragile conditions in which it operated.
The Waddell & Reed Order
At approximately 2:32 p.m. Eastern Time, mutual fund company Waddell & Reed Financial initiated an automated sell program to hedge an existing equity position. It called for the sale of 75,000 E-mini S&P 500 futures contracts, valued at roughly $4.1 billion. Under normal circumstances, a block of that size would be worked gradually over several hours with careful attention to market conditions and price impact.
Waddell & Reed's algorithm, though, operated on a blunt volume-participation logic. It was programmed to feed sell orders into the market at a rate pegged to a target percentage of prevailing volume — with no sensitivity to price, to time, or to whether the market could absorb the pressure. As the joint CFTC-SEC report later found, the algorithm completed the entire sale in approximately 20 minutes, a pace that would normally require five hours or more for a block of that magnitude (CFTC and SEC, 2010).
E-mini S&P 500 futures are among the most liquid instruments in the world, with daily volume often exceeding two million contracts. Even the deepest markets have limits. As the algorithm relentlessly pushed sell orders into the book, it overwhelmed available buy-side liquidity at each price level. The market impact of large orders is well-studied; what made this case singular was the algorithm's complete indifference to the destruction it was inflicting on the order book.
The Liquidity Vacuum
U.S. equity market structure had changed profoundly in the years before the crash. By 2010, high-frequency trading firms accounted for an estimated 50 to 70 percent of all equity volume. These firms served as de facto market makers, continuously posting buy and sell orders and profiting from the bid-ask spread. Unlike the traditional specialists of earlier decades, HFT firms had no obligation to maintain orderly markets. They could withdraw their orders at any time, for any reason — and that is exactly what they did.
As Waddell & Reed's selling pressure intensified, HFT firms began detecting what traders call toxic order flow: a persistent, large, directional selling pattern signaling a high probability of further price declines. Each firm's individual response was rational — reduce exposure, pull back quotes, wait for the imbalance to resolve. Collectively, the effect was catastrophic. Dozens of HFT firms withdrew within seconds of each other, creating a liquidity vacuum at precisely the moment liquidity was needed most.
Kirilenko et al. (2017) documented this dynamic in granular detail using account-level data from the CME Group. HFT firms that had been net buyers earlier in the day — providing crucial liquidity — rapidly reversed to become net sellers as the crash unfolded, their withdrawal measured in milliseconds. These firms traded in a pattern the researchers called "hot potato," rapidly passing contracts among themselves without absorbing any net inventory, amplifying the downward pressure rather than cushioning it.
36 Minutes of Chaos
What followed was unlike anything market participants had witnessed. Price cascades transmitted instantly from E-mini futures in Chicago to equities in New York through index arbitrage linkages — the same mechanism that had amplified Black Monday in 1987, but operating at electronic speed rather than through human floor traders.
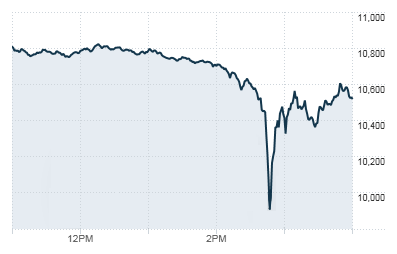
Between 2:32 p.m. and 2:47 p.m., the Dow Jones Industrial Average plummeted 998.5 points — a decline of approximately 9.2 percent. In fifteen minutes, more than $1 trillion in market value vanished.
Individual stocks suffered price dislocations that defied reason. Accenture — a company worth over $30 billion — briefly traded at one cent per share. Procter & Gamble dropped from $60 to $39 within minutes. Some securities spiked in the opposite direction: Sotheby's briefly traded at $99,999.99. These anomalies occurred because the withdrawal of market makers left only limit orders sitting deep in the order book — some placed as jokes or placeholders at absurd prices — as the sole available bids and offers.
| Time (ET) | Event |
|---|---|
| 9:30 a.m. | Markets open lower on European debt fears; Dow down ~1% at open |
| 1:00 p.m. | S&P 500 down roughly 2.5%; VIX up over 20% |
| 2:32 p.m. | Waddell & Reed algorithm begins selling 75,000 E-mini contracts |
| 2:41 p.m. | CME Group's stop-logic functionality triggers a 5-second pause in E-mini trading |
| 2:45 p.m. | Dow down over 700 points; individual stocks begin hitting stub quotes |
| 2:47 p.m. | Dow hits intraday low of 9,869; Accenture trades at $0.01 |
| 2:50 p.m. | Rapid recovery begins as bargain hunters and algorithms re-enter |
| 3:08 p.m. | Dow recovers to within 400 points of morning level |
| 4:00 p.m. | Dow closes at 10,520; down 347 points (3.2%) for the day |
At 2:45 p.m., a built-in safeguard at the Chicago Mercantile Exchange — the stop-logic functionality — triggered a five-second trading pause in the E-mini contract after detecting the velocity of the price decline. Five seconds. That brief interruption proved to be the turning point: it allowed the order book to partially rebuild, gave human traders a moment to assess conditions, and broke the feedback loop. When trading resumed, prices began recovering almost immediately. By 3:08 p.m. — roughly 36 minutes after the crash began — the Dow had clawed back the majority of its losses.
The Spoofing Connection: Navinder Sarao
For five years, regulators and academics debated whether factors beyond the Waddell & Reed order had contributed to the crash. In April 2015, the U.S. Department of Justice arrested Navinder Singh Sarao, a British futures trader who operated from his parents' house in Hounslow, west London.
Sarao was charged with spoofing — placing large orders he intended to cancel before execution to create a false impression of supply and demand. According to the indictment, he had used a custom-modified trading program to place and rapidly cancel thousands of E-mini sell orders in the hours and minutes before the crash. These phantom orders, at times representing a significant share of visible sell-side depth, created the illusion of enormous selling pressure, encouraging other participants to sell and contributing to the fragile conditions in which the Waddell & Reed algorithm operated.
In 2016 Sarao pleaded guilty to spoofing and wire fraud. A federal judge sentenced him in 2020 to home detention rather than prison, citing his cooperation with authorities and a diagnosis of Asperger syndrome. From a bedroom with consumer-grade internet access, Sarao had earned approximately $70 million over several years through spoofing — a case that raised uncomfortable questions about how vulnerable electronic markets had become to manipulation by a single person.
Regulatory Response
What followed was the most significant overhaul of U.S. equity market structure rules since Regulation NMS in 2005. A joint CFTC-SEC report issued in September 2010 provided the first detailed reconstruction of the event (CFTC and SEC, 2010), and its finding — that one algorithmic order could destabilize the entire market — jolted the financial industry.
Immediately after the crash, the SEC implemented single-stock circuit breakers for all S&P 500 stocks, pausing trading for five minutes if a stock moved more than 10 percent in a five-minute window. In 2012 these were replaced by the more sophisticated Limit Up-Limit Down (LULD) mechanism, which prevents trades from executing outside price bands that recalculate throughout the trading day. Rule 15c3-5, the Market Access Rule, required brokers to impose pre-trade risk controls on all orders.
Market-wide circuit breakers — originally introduced after the 1987 crash — were updated from fixed-point thresholds to percentage-based triggers tied to the S&P 500. Separately, the Dodd-Frank Act of 2010, primarily a response to the 2008 financial crisis, made spoofing a criminal offense — language later used to prosecute Sarao.
Exchanges also formalized procedures for breaking clearly erroneous trades. On the evening of May 6, exchanges had canceled all trades executed at prices more than 60 percent from their pre-crash levels. That ad hoc decision left thousands of traders unsure which trades would stand and which would be voided, piling confusion on top of an already chaotic day.
Legacy: A Fragile Machine
No lasting economic damage resulted from the Flash Crash. Markets closed only modestly lower, erroneous trades were broken, and no major financial institution failed. Yet the event permanently altered how regulators, market participants, and the public understood the risks embedded in modern market structure.
May 6 revealed that fragmenting equity trading across dozens of exchanges and dark pools — while relying on high-frequency market makers with no affirmative obligation to provide liquidity — had produced a system that was efficient and cheap in normal conditions but dangerously brittle under stress. Where the LTCM crisis of 1998 had exposed the dangers of concentrated leverage, the Flash Crash exposed the dangers of distributed fragility.
Subsequent years brought additional flash events that reinforced the point. In August 2015, hundreds of exchange-traded funds dislocated when market makers withdrew at the open during uncertainty over Chinese equities. In October 2016, the British pound fell more than 6 percent against the dollar in seconds during Asian trading hours — a move attributed to algorithms trading in thin liquidity. Sharp intraday swings tied to algorithmic momentum strategies hit bond and equity markets again in December 2018.
A tension at the heart of modern markets remains unresolved. Algorithmic trading has made markets faster, cheaper, and more efficient in ordinary times — bid-ask spreads have narrowed, transaction costs have fallen, and price discovery is nearly instantaneous. But on May 6, 2010, the machines that had been built to make markets more orderly demonstrated, in 36 minutes, their capacity to produce the opposite result. When every algorithm providing liquidity simultaneously decides to withdraw, the market falls through a trapdoor that no human participant saw coming.
Related
Market Histories Learn more about our methodology.